Linux 网络状况
时间:2018-01-10 19:01:03
参考:
环境:
- CentOS 7
Linux 网络状况
简单查看 ping
-
检查网络是否异常:
ping www.baidu.com
查看实时网络流量 iftop
-
安装
yum install iftop -
命令说明
``` 语法: iftop -h | [-npblNBP] [-i interface] [-f filter code] [-F net/mask] [-G net6/mask6]
-h 显示本帮助(Help)信息
-n 不进行主机名(hostName)查找
-N 不将端口号(port Number)转换成对应的服务 to services
-p 混合(Promiscuous)模式(显示网络相关的其他主机信息)
-b 不显示流量图形条(Bar)
-B 以字节(Byte)为单位,显示带宽(Bandwidth);默认以比特(bit)显示的
-i interface 监控的网卡接口(interface)
-f filter code 包统计时,使用过滤码;默认:无,只统计IP包
-F net/mask 显示特定IPv4网段的进出流量(Flow);如# iftop -F 10.10.1.0/24
-G net6/mask6 显示特定IPv6网段的进出流量(Flow)
-l 显示并统计IPv6本地(Local)链接的流量(默认:关)
-P 显示端口(Port)
-m limit 设置显示界面上侧的带宽刻度(liMit)
-c config file 指定配置(Config)文件
-t 使用不带窗口菜单的文本(text)接口排序: -o 2s Sort by first column (2s traffic average) -o 10s Sort by second column (10s traffic average) [default] -o 40s Sort by third column (40s traffic average) -o source Sort by source address -o destination Sort by destination address The following options are only available in combination with -t -s num print one single text output afer num seconds, then quit -L num number of lines to print```
-
界面说明
iftop命令界面:
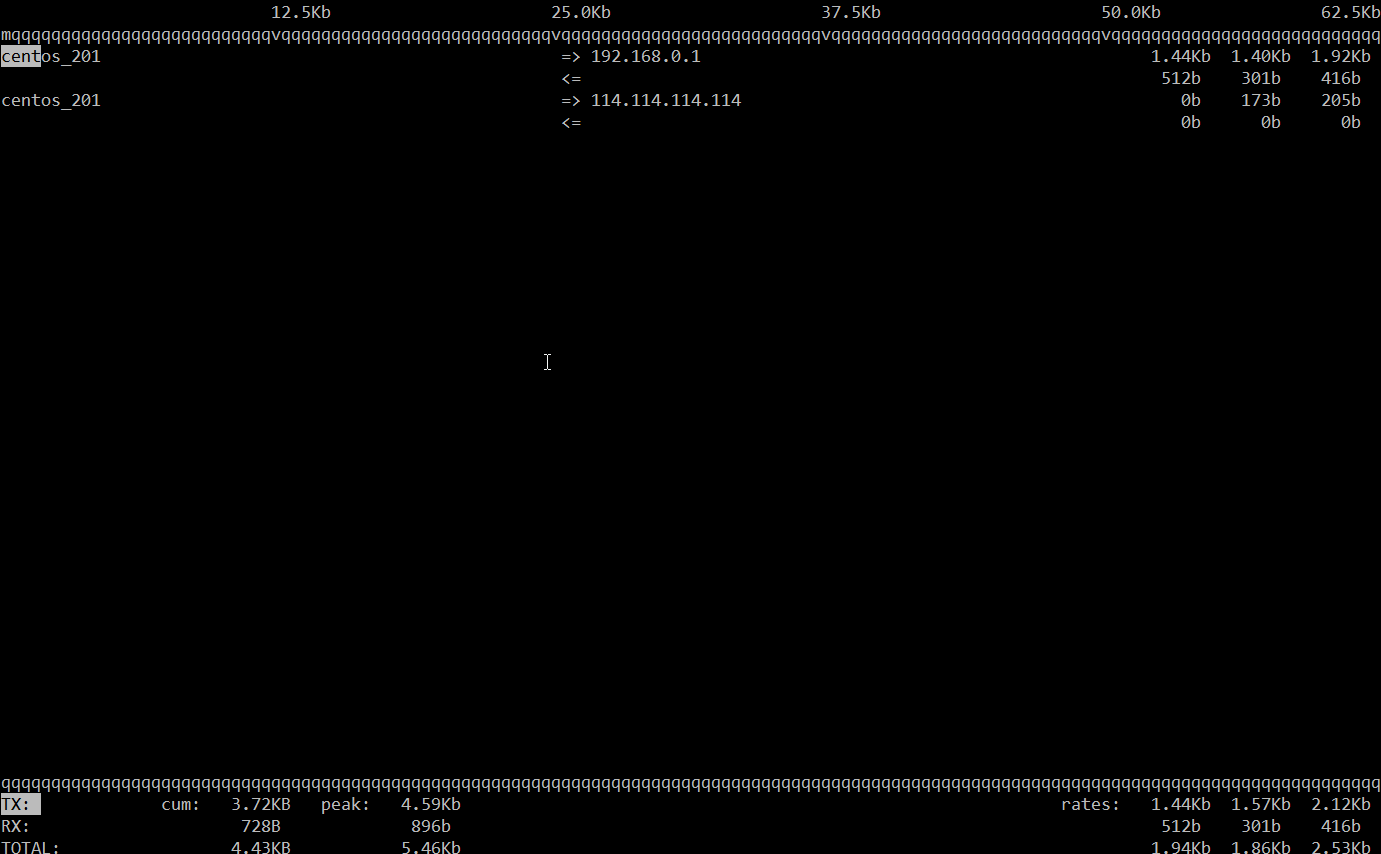
界面说明:
界面上面显示的是类似刻度尺的刻度范围,为显示流量图形的长条作标尺用的。
白色块儿代表百分比
前面IP是本机的(Source),后面IP远程主机的(Dest);
中间的<= =>这两个左右箭头,表示的是流量的方向。
右侧的三列数值:
第一列是:在此次刷新之前2s或10s或40s的平均流量(按B设置秒数);
第二列是:在此次刷新之前10秒钟的总流量的一半;
第三列是:在此次刷新之前40秒钟的总流量的1/5;
TX:发送(Transmit)流量;RX:接收(Receive)流量;TOTAL:总流量;
cum:运行iftop到目前时间的总和(Cum);peak:流量峰(Peak)值;
rates:分别表示过去 2s 10s 40s 的平均流量;
界面交互命令:再界面里面上 `h` 键

Host display:                          General:
 n - toggle DNS host resolution         P - pause display
 s - toggle show source host            h - toggle this help display
 d - toggle show destination host       b - toggle bar graph display
 t - cycle line display mode            B - cycle bar graph average
                                        T - toggle cumulative line totals
Port display:                           j/k - scroll display
 N - toggle service resolution          f - edit filter code
 S - toggle show source port            l - set screen filter
 D - toggle show destination port       L - lin/log scales
 p - toggle port display                ! - shell command
                                        q - quit
Sorting:
 1/2/3 - sort by 1st/2nd/3rd column
 < - sort by source name
 > - sort by dest name
 o - freeze current order

iftop, version 1.0pre4
网速测试 speedtest.py
- 下载文件:
wget https://raw.github.com/sivel/speedtest-cli/master/speedtest.py --no-check-certificate- 修改文件权限:
chmod 100 speedtest.py - 运行脚本 :
./speedtest.py -
运行结果:
Retrieving speedtest.net configuration... Testing from hongkong kwaifong information service limited (...)... Retrieving speedtest.net server list... Selecting best server based on ping... Hosted by STC (Hong Kong) [4.08 km]: 12.056 ms Testing download speed................................................................................ Download: 2.91 Mbit/s Testing upload speed................................................................................................ Upload: 2.33 Mbit/s
- 修改文件权限: